Behaviour of Real Gases : Deviation From Ideal Gas Behaviour :
`=>` Our theoritical model of gases corresponds very well with the experimental observations.
`=>` Difficulty arises when we try to test how far the relation `pV = nRT` reproduce actual pressure-volume-temperature relationship of gases.
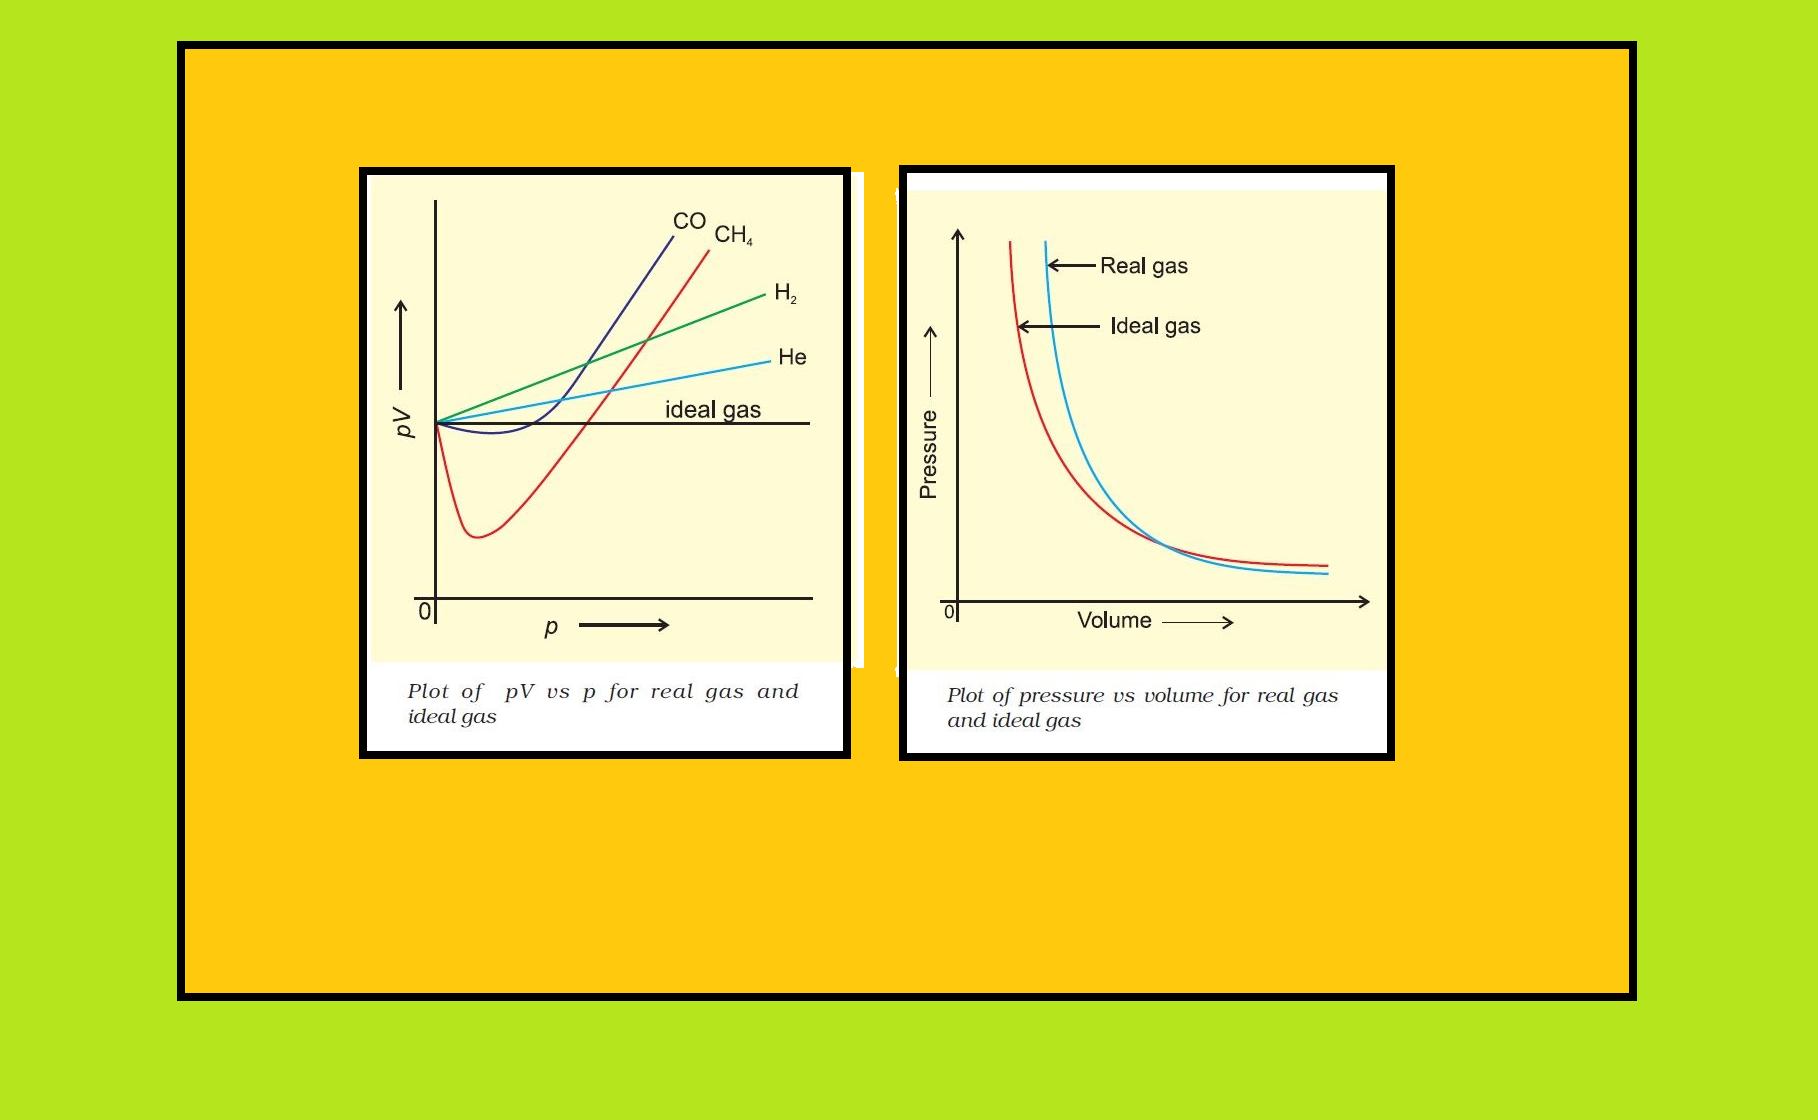
● To test this point, we plot `pV` vs `p` plot of gases because at constant temperature, `pV` will be constant (Boyle’s law) and `pV` vs `p` graph at all pressures will be a straight line parallel to `x`-axis.
● Fig. shows such a plot constructed from actual data for several gases at `273 K`.
`=>` It can be seen easily that at constant temperature `pV` vs `p` plot for real gases is not a straight line.
● There is a significant deviation from ideal behaviour.
`=>` Two types of curves are seen.
`=>` In the curves for dihydrogen and helium, as the pressure increases the value of `pV` also increases.
`=>` The second type of plot is seen in the case of other gases like carbon monoxide and methane.
● In these plots first there is a negative deviation from ideal behaviour, the `pV` value decreases with increase in pressure and reaches to a minimum value characteristic of a gas. After that `pV` value starts increasing. The curve then crosses the line for ideal gas and after that shows positive deviation continuously.
● It is thus, found that real gases do not follow ideal gas equation perfectly under all conditions.
`=>` Deviation from ideal behaviour also becomes apparent when pressure vs volume plot is drawn.
● The pressure vs volume plot of experimental data (real gas) and that theoretically calculated from Boyle’s law (ideal gas) should coincide.
● Fig 5.9 shows these plots.
● It is apparent that at very high pressure the measured volume is more than the calculated volume.
● At low pressures, measured and calculated volumes approach each other.
● It is found that real gases do not follow, Boyle’s law, Charles law and Avogadro law perfectly under all conditions.
`=>` Now two questions arise.
(i) Why do gases deviate from the ideal behaviour?
(ii) What are the conditions under which gases deviate from ideality?
We get the answer of the first question if we look into postulates of kinetic theory once again. We find that two assumptions of the kinetic theory do not hold good. These are
(a) There is no force of attraction between the molecules of a gas.
(b) Volume of the molecules of a gas is negligibly small in comparison to the space occupied by the gas.
● If assumption (a) is correct, the gas will never liquify. However, we know that gases do liquify when cooled and compressed. Also, liquids formed are very difficult to compress. This means that forces of repulsion are powerful enough and prevent squashing of molecules in tiny volume.
● If assumption (b) is correct, the pressure vs volume graph of experimental data (real gas) and that theoritically calculated from Boyles law (ideal gas) should coincide.
`=>` Difficulty arises when we try to test how far the relation `pV = nRT` reproduce actual pressure-volume-temperature relationship of gases.
● To test this point, we plot `pV` vs `p` plot of gases because at constant temperature, `pV` will be constant (Boyle’s law) and `pV` vs `p` graph at all pressures will be a straight line parallel to `x`-axis.
● Fig. shows such a plot constructed from actual data for several gases at `273 K`.
`=>` It can be seen easily that at constant temperature `pV` vs `p` plot for real gases is not a straight line.
● There is a significant deviation from ideal behaviour.
`=>` Two types of curves are seen.
`=>` In the curves for dihydrogen and helium, as the pressure increases the value of `pV` also increases.
`=>` The second type of plot is seen in the case of other gases like carbon monoxide and methane.
● In these plots first there is a negative deviation from ideal behaviour, the `pV` value decreases with increase in pressure and reaches to a minimum value characteristic of a gas. After that `pV` value starts increasing. The curve then crosses the line for ideal gas and after that shows positive deviation continuously.
● It is thus, found that real gases do not follow ideal gas equation perfectly under all conditions.
`=>` Deviation from ideal behaviour also becomes apparent when pressure vs volume plot is drawn.
● The pressure vs volume plot of experimental data (real gas) and that theoretically calculated from Boyle’s law (ideal gas) should coincide.
● Fig 5.9 shows these plots.
● It is apparent that at very high pressure the measured volume is more than the calculated volume.
● At low pressures, measured and calculated volumes approach each other.
● It is found that real gases do not follow, Boyle’s law, Charles law and Avogadro law perfectly under all conditions.
`=>` Now two questions arise.
(i) Why do gases deviate from the ideal behaviour?
(ii) What are the conditions under which gases deviate from ideality?
We get the answer of the first question if we look into postulates of kinetic theory once again. We find that two assumptions of the kinetic theory do not hold good. These are
(a) There is no force of attraction between the molecules of a gas.
(b) Volume of the molecules of a gas is negligibly small in comparison to the space occupied by the gas.
● If assumption (a) is correct, the gas will never liquify. However, we know that gases do liquify when cooled and compressed. Also, liquids formed are very difficult to compress. This means that forces of repulsion are powerful enough and prevent squashing of molecules in tiny volume.
● If assumption (b) is correct, the pressure vs volume graph of experimental data (real gas) and that theoritically calculated from Boyles law (ideal gas) should coincide.